Maps for Every Use Case
From election results to migration patterns — find the map type for your data
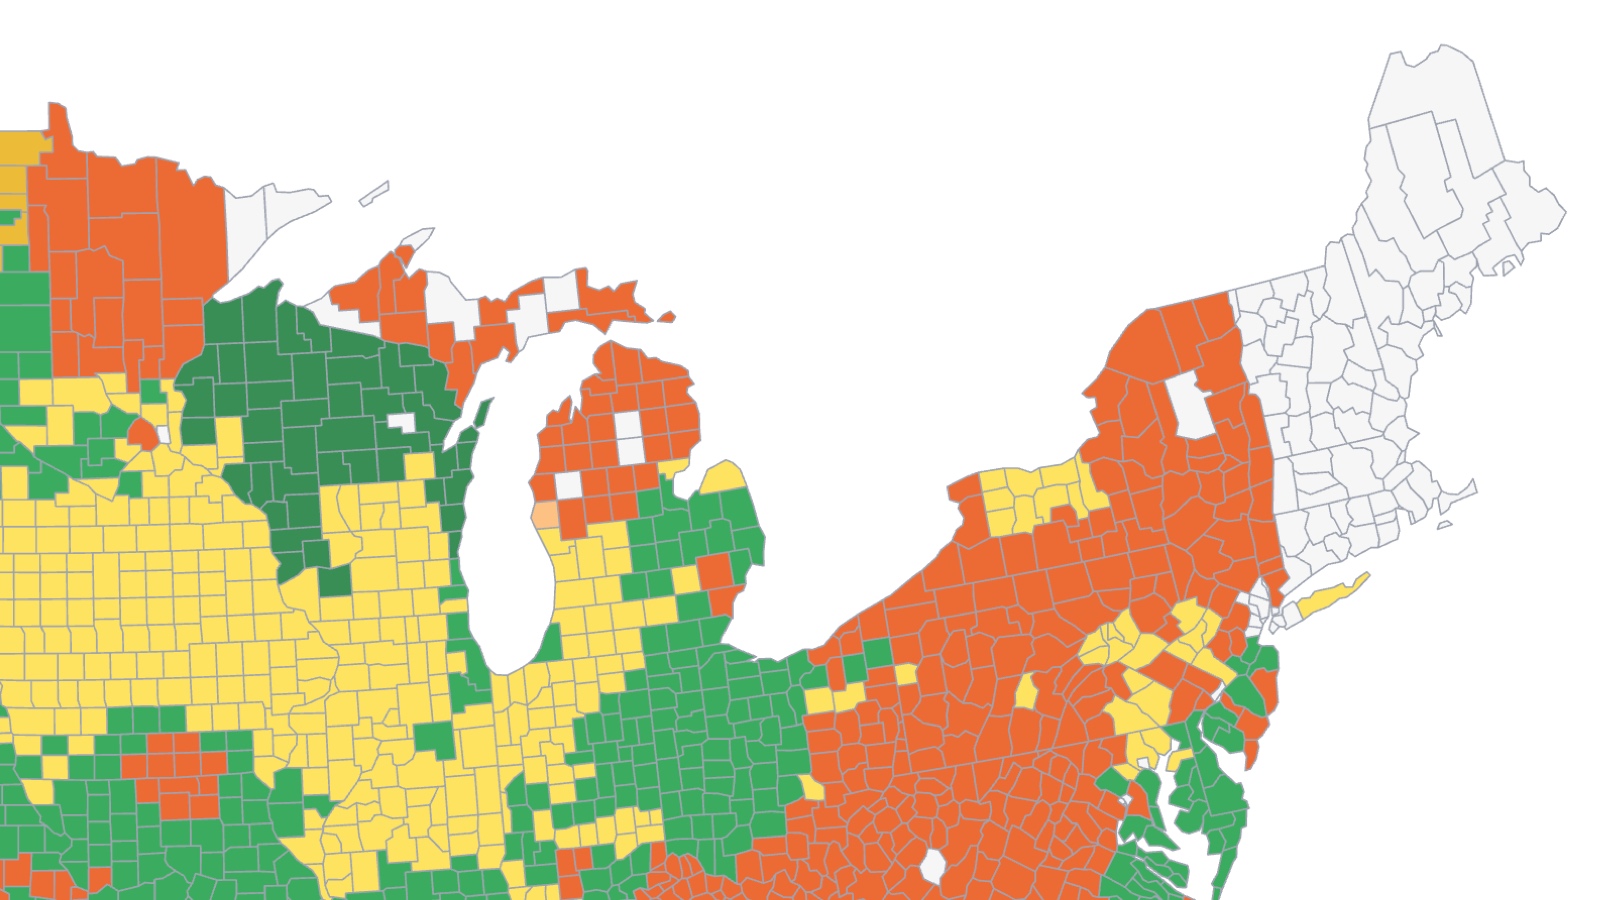
Choropleth Maps
Show data using color-coded regions where different colors or intensities represent data values across geographic boundaries.
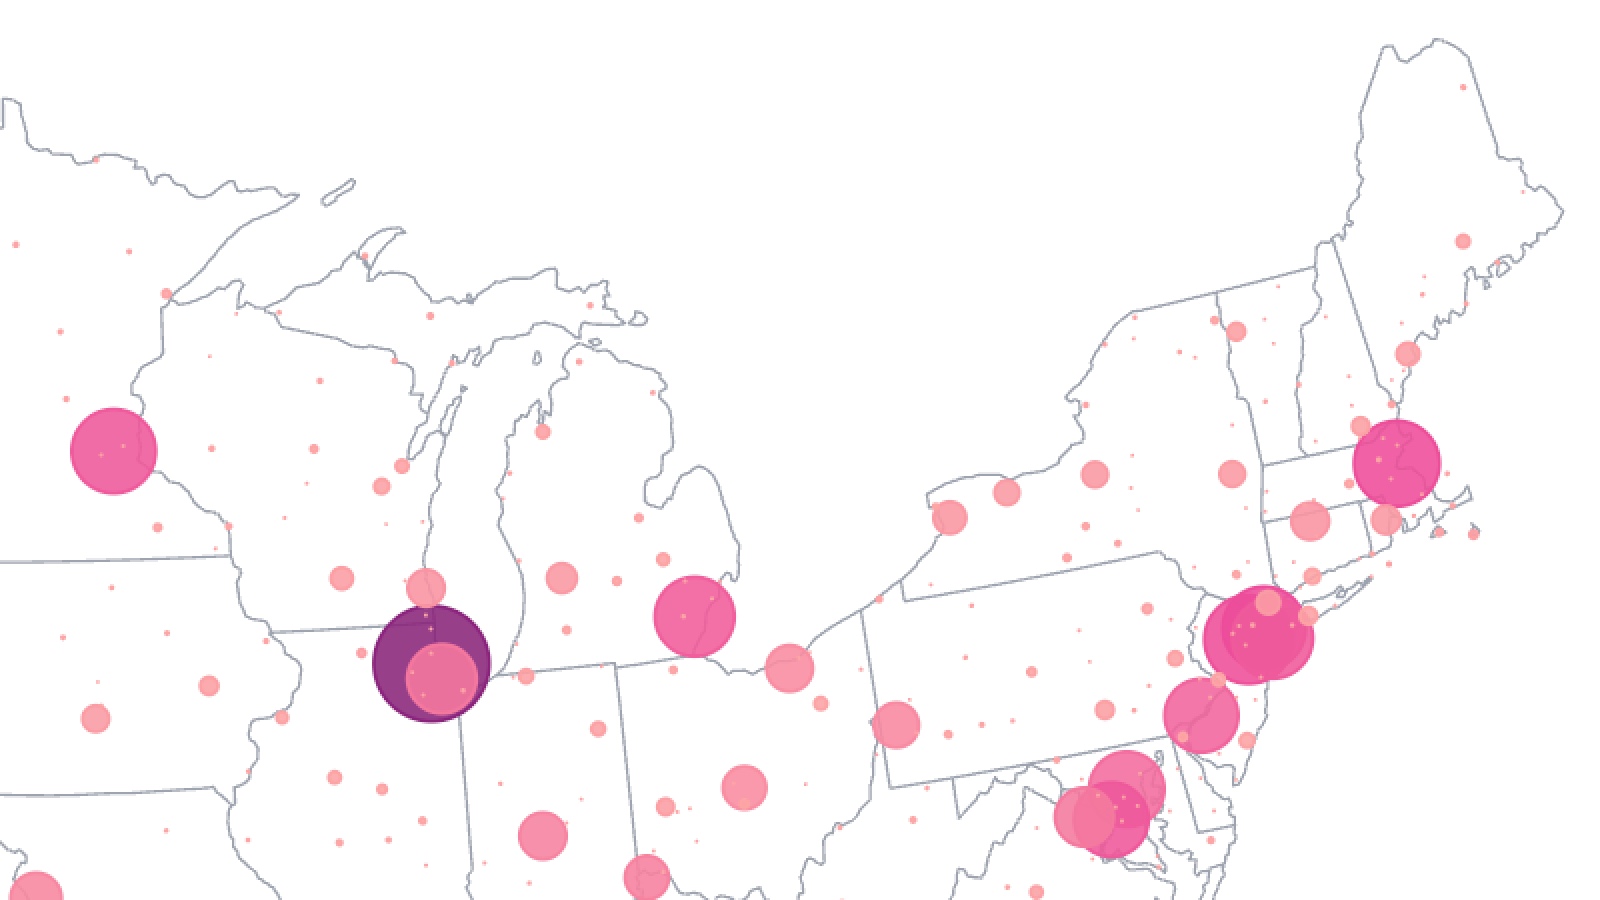
Symbol Maps
Use symbols positioned on the map where symbol size and color can depict multiple dimensions simultaneously.
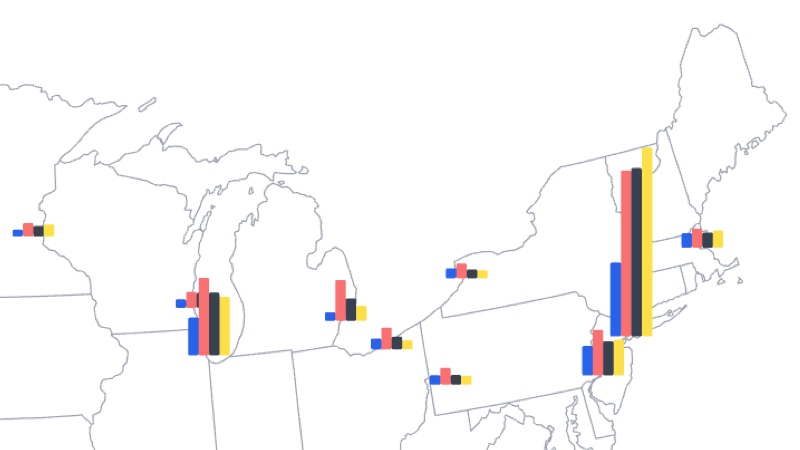
Bar Maps
Display multiple series of data using 3D bars positioned on geographic locations, with each bar representing different data values.
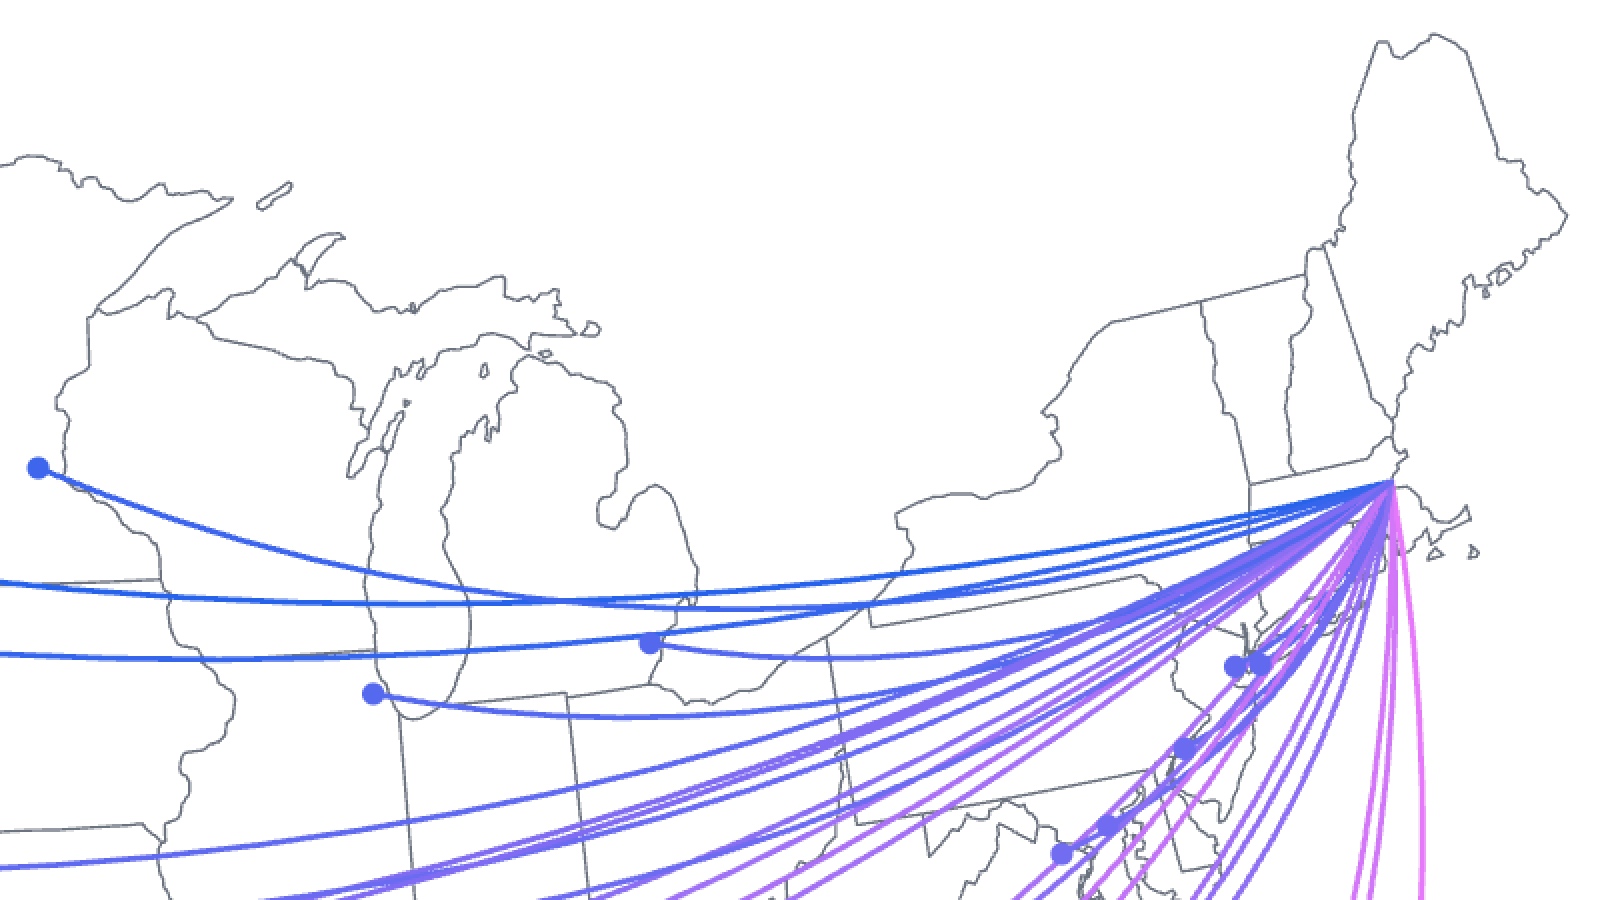
Flow Maps
Visualize movement and connections between geographic locations to show migration patterns, trade routes, and more.
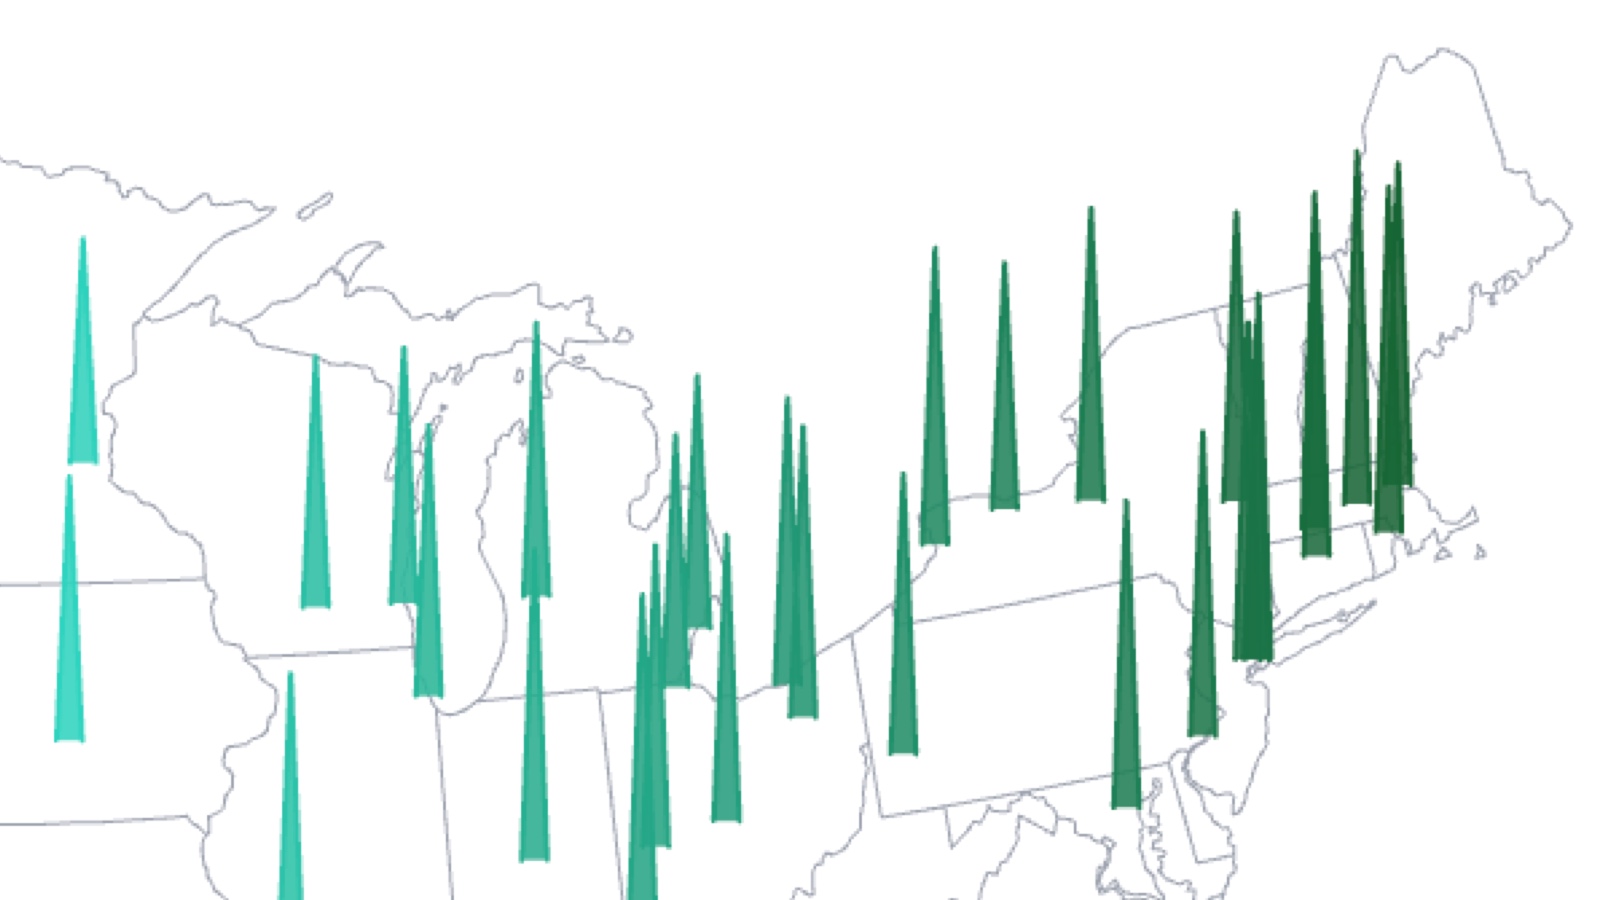
Spike Maps
Display single data values using thin spikes positioned on geographic locations.
Arrow Maps
Display directional data using arrows positioned on geographic locations to show flow patterns, movement, or directional trends.
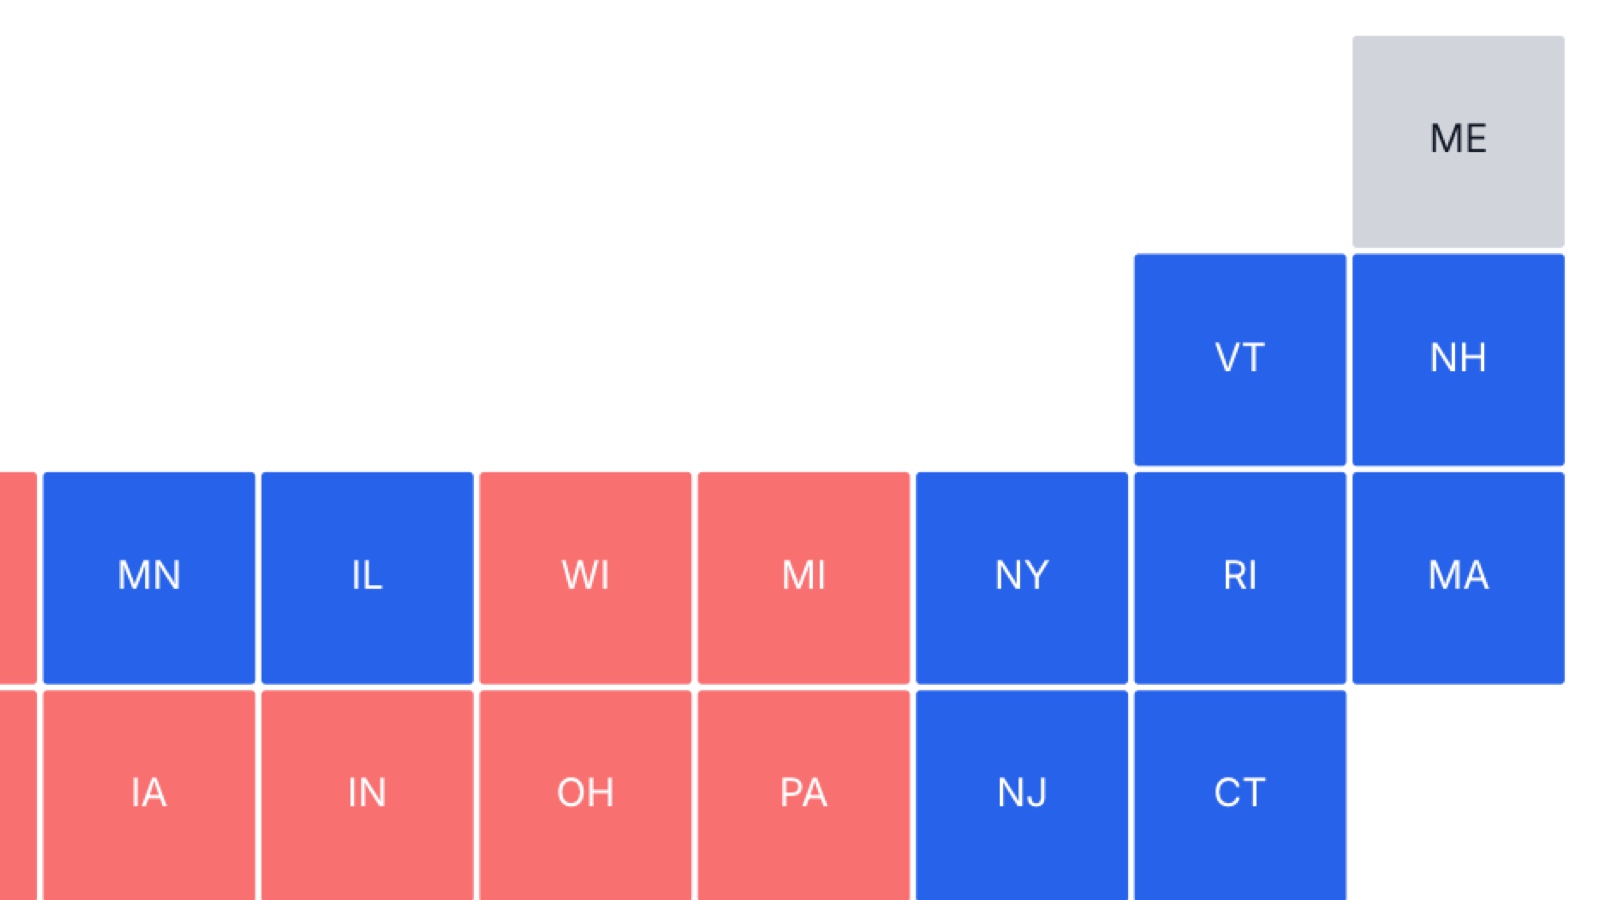
Grid Maps
Show each geographic unit equally sized, ensuring smaller areas aren't lost on the map.
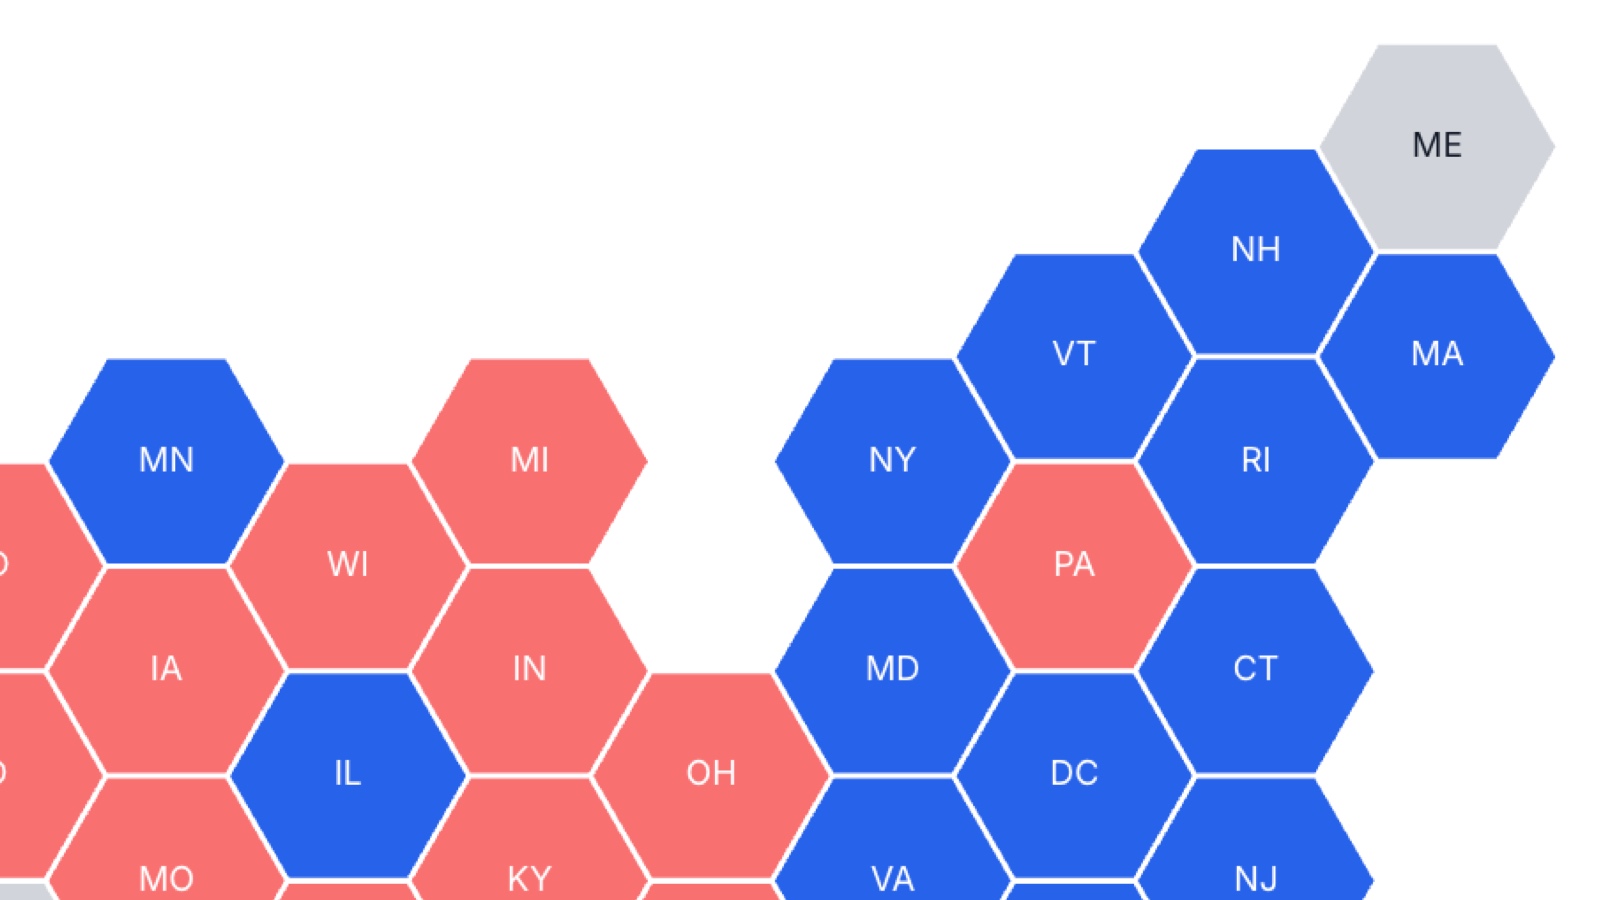
Hex Maps
Show each geographic unit equally sized using hexagonal shapes for a more visually appealing alternative.
Powerful Mapping Platform
Everything you need to create professional maps at scale
8
Map Types
600+
Basemaps
195+
Countries
14
Projections
Advanced Mapping Features
Professional tools that make your maps more engaging and informative
Interactive Tooltips
Hover over map elements to see detailed data with customizable tooltip content.
Real-time Filtering
Connect maps to filter elements for dynamic user interaction and data exploration.
Custom Annotations
Add text and symbols to highlight specific locations or provide additional context.
Flexible Projections
Choose from multiple map projections including Mercator, Albers, and specialized regional projections.
Color Gradients
Apply sophisticated color schemes with customizable gradients and scales for data visualization.
Export Options
Export maps as PNG, SVG, or PDF for use in presentations, reports, or print materials.